 User Help Manual
  Learn FAQ
  Send us feedback
 ")


 Video Editor
 Video Converter
 Audio Tools
 Store templates
 Cloud
Cloud


Quick start:
- Import video
- Add Telemetry (extract from GoPro или import GPX)
- Pick a template (map/speed/altitude dashboard)
- Sync to video + Time shift if needed
- Export
Compatibility
Cameras: GoPro / Insta360 / Garmin / phone GPX export.
Every twist, jump and freefall moment in your footage is more than just a video: it's a story waiting to be told in a completely new way.
With the GPS visualization tool that first appeared in VSDC 10.1 and became even more functional starting from version 10.2, your action clips transform into eye-catching travelogues. Exclusively in VSDC, you get GPS functionality whose analogues are hard to find elsewhere!
Add routes, overlay them on maps, display a compass, speed via customizable gauges, altitude graphs and much more: all within VSDC! The process is intuitive and doesn't take much time.
Let's explore all the details of how it works. But first, the most important thing:
Ensure you have VSDC Video Editor version 10.2 or higher installed!
Adding GPS Data Files
The first step as usual is importing your GPS data into VSDC. The process is flexible and supports two primary methods.
If you have a separate GPS data file, such as a .GPX export from your action camera or a dedicated tracking device, you can load it directly. Simply click the "Add telemetry" button on the toolbar to the left of the preview screen. It opens a menu with several options: GPS path, Telemetry widget, Telemetry text values and Telemetry templates.
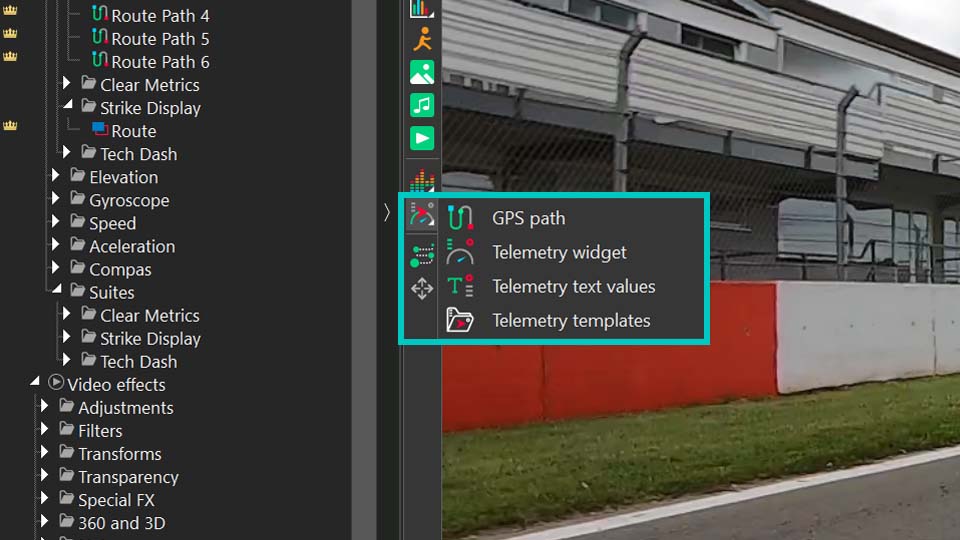
The GPS path option is the most straightforward way to visualize your route's track from a GPX file. Use this if your primary goal is to display the route itself and work directly with the path overlay. The next two options—Telemetry widget and Telemetry text values—allow for creating custom gauges and displays (please check out this video to see how to do it). Finally, Telemetry templates opens a gallery of pre-designed styles.
Note that when using templates, you first select your preferred visual style via this option, then double-click the generated object on the timeline and click on the dedicated GPS object. In its properties window you link the object to your GPX file via the Telemetry resource option, which will populate the template with your data.
For GoPro and other action camera users with GPS enabled, the process is simpler. VSDC can automatically detect and extract the telemetry data embedded directly in the video file. Just import your clip as usual, and the editor will promptly ask if you'd like to extract the GPS data and place it in the Resources window. A simple confirmation is all it takes.
Once imported via either method, your telemetry data becomes a standalone asset. You can find it in the Resources window under the "Telemetry" section, where its icon indicates its origin. The moment you drag this telemetry object from the Resources window onto your scene, VSDC will present the "Telemetry templates" gallery. Here you can choose the visual style for your data, selecting from a range of ready-made gauges, graphs and maps that will overlay your video.
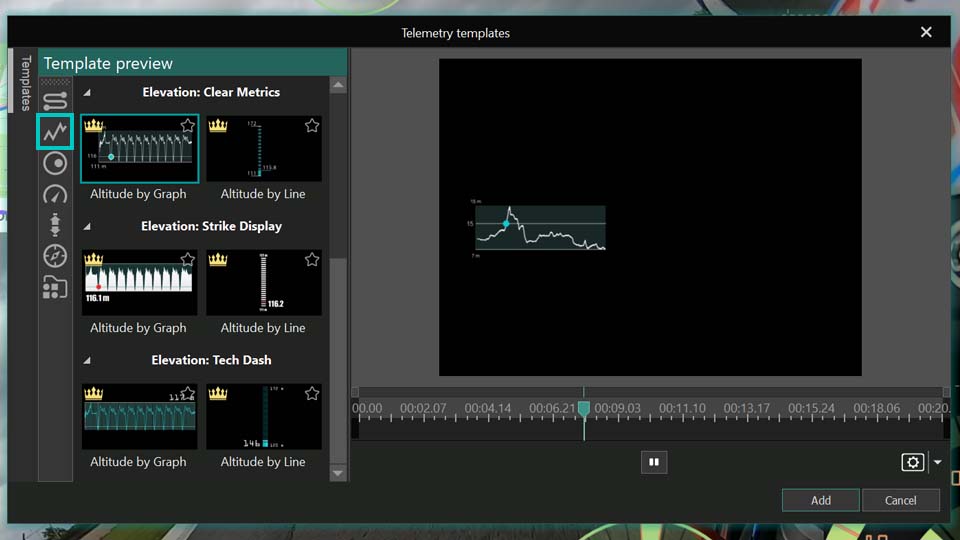
Setting Up Widgets
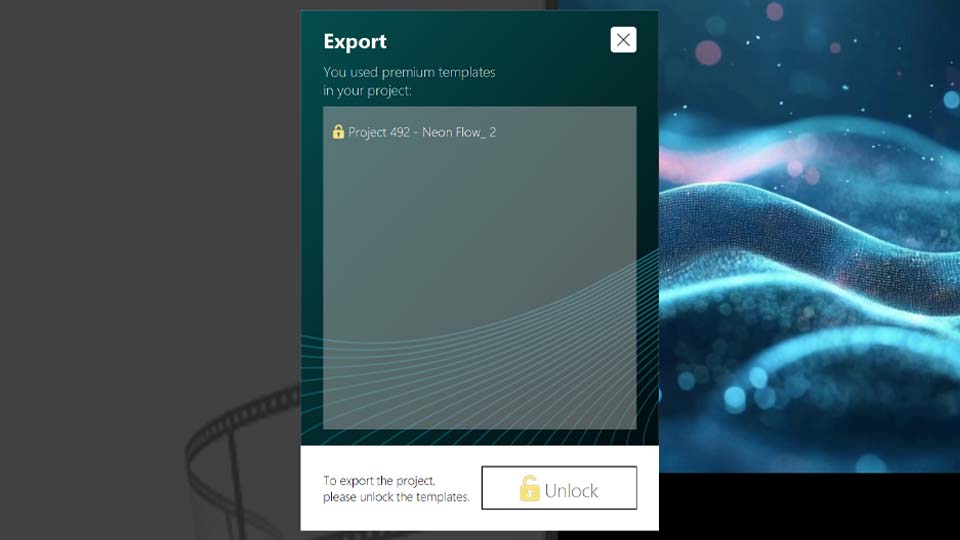
So, we've found ourselves in the telemetry template window. There are plenty of templates here for things like path tracking, speed, altitude and more. Just a quick heads-up: you can try all these features for free inside the editor, but exporting will require a VSDC Pro license. And if you're using Premium packs, you'll need to purchase the ones featured in your projects. You can buy packs individually or grab them all at once with the handy Bundle Offer.
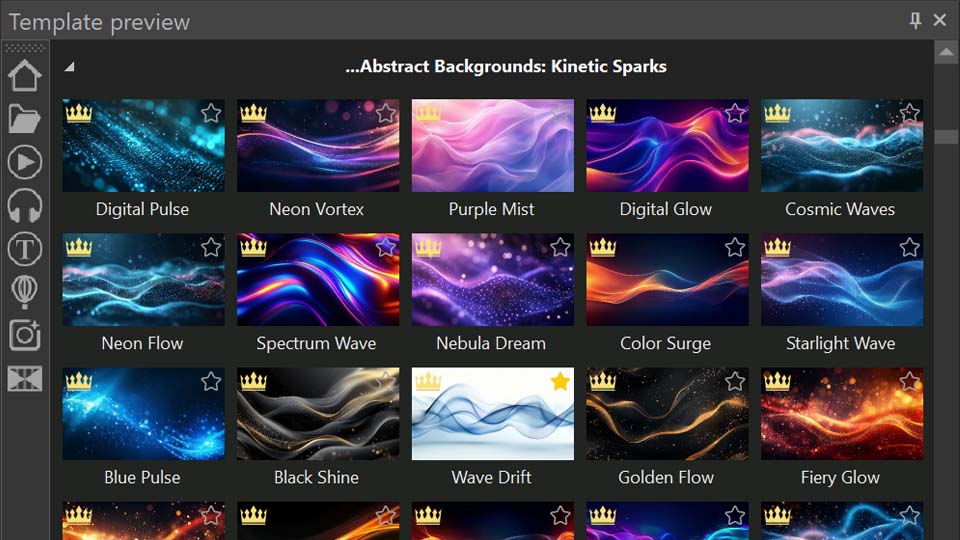
Visit our Store to see all the collections available.
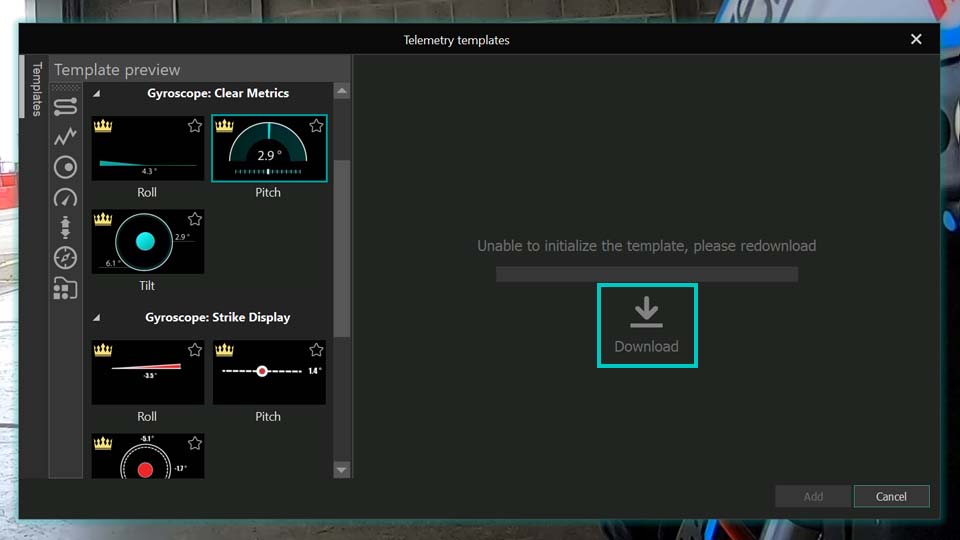
If you pick a template and find the "Add" option isn't available or you don't see anything in the preview, just click the "Download" button inside it. Once you're happy with how it looks here, go ahead and add it to your video.
Remember, you're not limited to adding just one template at a time, you can add entire dashboards, as we mentioned earlier. For our walkthrough, we'll actually use a dashboard to better illustrate the different settings available for each type of template.
All the dashboards are located in the last option inside the telemetry templates window. Let's go with the "Mint" style. Now we have a whole set of different sensors right on the scene. Notice that each one is nested inside a Template object, with the actual GPS objects placed inside those templates. It's important to make sure these GPS objects are linked to the correct GPX files. Simply double-click each template, locate the GPS object inside, and using the Properties window, check or reassign the correct source (your video name) via the "Telemetry resource" option.
Each type of template, whether it's a speedometer, path or something else, comes with its own set of customizable settings. Let's explore each one.
GPS Path
So, the first GPS object whose settings we'll explore is the Path. Let's double-click the template, then the GPS object on the timeline to open the Properties window for this widget. At the top we'll see the standard settings for duration, position, and so on. But what we're really interested in is the section dedicated specifically to telemetry settings.
As you can see, there's quite a lot you can do here to change how the path looks on the scene. The first option, Presets, lets you browse through different ready-to-use template variations for the path.
Telemetry resource is where you choose the source for your data. Just as important is the next option: Sync to video. It helps synchronize your data with the video, which is especially useful if the video or data file has been trimmed, moved on the timeline, or otherwise edited. But keep in mind that this option can be disabled if you are working with GPX file itself because it hasn't got any information about a video. If you notice any discrepancy in the timing, be sure to expand this option and adjust the Time shift value to match your specific situation. It may not be available for the path track, but it can always be used for other widgets.
Next, you'll find options for working with maps. You can generate a Google Maps link to locate where the footage or data was recorded. You can also load a map directly and place it underneath your path trajectory. Just keep in mind that some map features may require an API key.
After this come the settings dedicated to refining the path trajectory itself. This is where you can really tweak and adjust everything to your liking.
With Path mode you choose whether the path displays or its elevation as a simple line or as a filled graph. Stretch image controls whether the route image stretches to fit the designated frame.
If you want to avoid distorting the route image when it's resized, make sure "Stretch image" is turned off.
From there, you can adjust the line thickness, choose which point on the path is the starting point and set what percentage of the total path is displayed. These options are very important for creating drawing animation.
The Use embedded time option is useful if your .gpx file includes timestamp data. When activated, the marker will move along the route according to that timing: slower on some segments, faster on others. If it's inactive, the marker will move at a steady, uniform pace. If the option isn't available, it means your file either doesn't contain timing data or you've chosen not to use it.
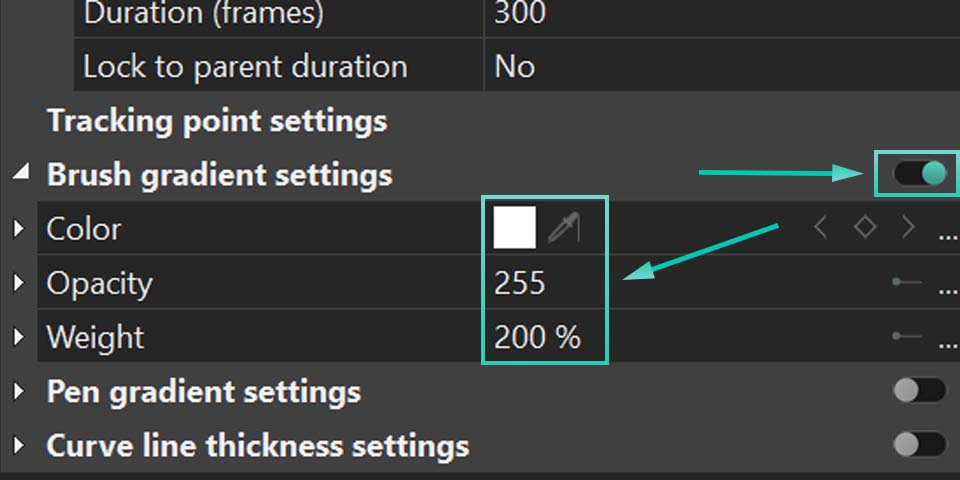
Enable gradient lets you add a gradient fill to the route itself. You can set it to change over time or by the elevation of the route.
Don't forget to click the small triangular icons next to options whenever you see them, they often open up additional settings. For example, in the color settings that follow, you can expand options to adjust transparency.
When Enable gradient is set to None, the Front color controls the route's color, with Opacity determining how transparent it is (0 is fully transparent, 255 is fully opaque). Back color is useful when you're only displaying a segment of the route using "Start point of path" and "Length of path". It lets you color the inactive parts of the route, with its own opacity control. If you don't need this, just set the Back color Opacity to zero.
If Enable gradient is set to By time or By elevation, then Start color defines the route color at the beginning of the video (for "By time") or at low-elevation sections (for "By elevation"). End color defines it at the end of the video or for high-elevation sections.
Gradient settings open a separate window where you can choose from preset gradients or customize your own before applying it.
Marker settings let you adjust the appearance of the moving point along the path. There you can adjust its size, form, position, etc.
There's another interesting category of settings here: text settings. If your .gpx file contains any textual elements like waypoint names, this section allows you to configure what text is displayed on the route and how it appears.
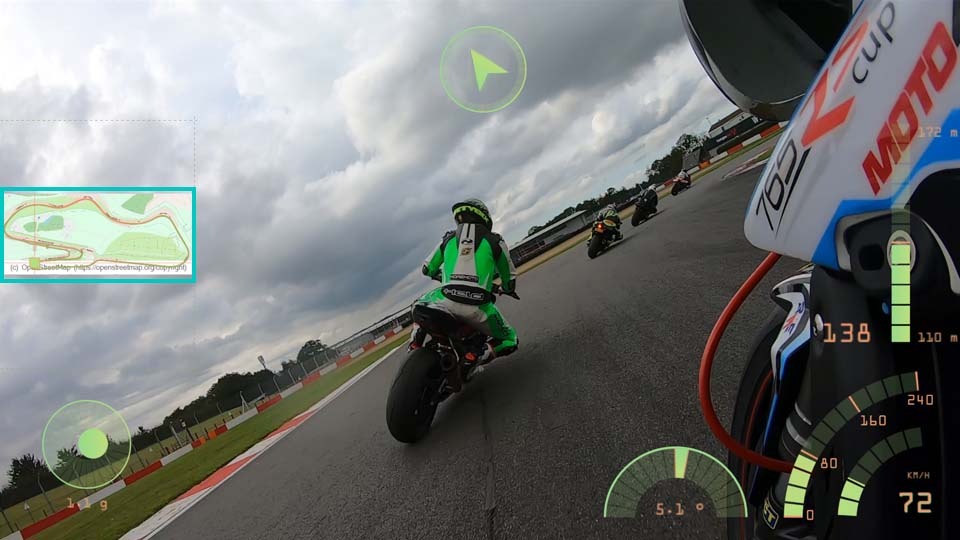
Please see what we can achieve using these settings:
For a clearer, more detailed walkthrough, be sure to check out our YouTube video dedicated to exploring this tool.
Altitude (Elevation)
The next template type in our dashboard is about altitude. Here, you'll see a graph representing the elevation profile along your route.
To customize it, click on the template and then double-click the GPS object on the timeline or simply double-click the altitude graph right on the scene. This will open its specific settings window.
As you'll notice, many of the general settings overlap with what we've seen before, which keeps things consistent. One particularly interesting option here is Use 4th-order filter, which helps smooth out the data in case it was recorded inconsistently or contains irregularities.
But the real focus is on the settings specific to elevation data. With the Brush option you can choose how to fill the empty space behind the graph making it transparent or adding a solid background, for instance.
The Telemetry metric option lets you decide what data to display. While this template is set for altitude, you can actually switch it to show speed or another metric if you prefer. For altitude, speed, and any other metrics that involve units of measurement, the Units option becomes available, allowing you to choose your preferred measurement system.
Next, you'll find a set of options dedicated to refining your data further. You can apply smoothing, set custom thresholds, enhance the overall quality of the graph and merge any duplicate data points. There are also settings to choose your data source type whether you want to use pre-processed (raw) data, raw data with only GPS filtering applied or the original recorded data.
Additionally, there's an option to fine-tune an echo filter, which can help clean up signal noise or repeated readings for a clearer, more accurate graph.
Inside a telemetry template on the timeline you'll also find a telemetry text object. Clicking on it opens a settings panel in the Properties window where you can customize the text within the template. It goes beyond basic text editing: you can adjust positioning, control how values are displayed (аccurate to tenths and hundredth), enable text effects and even use curve binding for dynamic animation.
Speedometer, Compass, Gyroscope, Acceleration
For these widgets the core settings are very similar to those of the altitude graph template. The real difference lies in their composition. Depending on the internal design of each template, the number of images, text objects and graphic elements: some may offer more customization layers than others. But each one gives you the creative freedom to tweak, adjust and personalize the original template, helping you craft something that feels uniquely yours.
You'll also notice effects that come as part of the template such as Zoom, Duotone, and others and these too can be customized! For a practical example, take a look at our video where we demonstrate how to import footage from a GoPro camera into the editor and enhance it with gauges. There you can see exactly how to work with the effects embedded within the template.
Unlock Your Creative Potential
Of course, the possibilities of these GPS tools are virtually limitless. With the right adjustments you can achieve a great deal, and all it takes is a willingness to experiment! We recommend starting with the ready-made presets, and once you feel comfortable, try your hand at creating your very own speedometer, compass or any other custom gauge you can imagine!
Looking for more inspiration? Subscribe to our YouTube channel for tutorials, tips and creative ideas!
And if you ever need direct support, our team is just a message away at This email address is being protected from spambots. You need JavaScript enabled to view it..
Frequently Asked Questions
Q1: Which versions of VSDC support GPS and telemetry features?
A: You need VSDC Video Editor version 10.2 or higher. The GPS visualization tool was first introduced in version 10.1, but version 10.2 offers expanded functionality.
Q2: Do I need a Pro license to use GPS features?
A: You can try all GPS and telemetry features for free inside the editor. However, exporting your final video with these overlays requires a VSDC Pro license. Additionally, some premium template packs may need to be purchased individually or as part of a bundle.
Q3: Can I add a map under my GPS route path?
A: Yes. In the GPS Path object settings you can load a map as a background for your route trajectory. Please note that some advanced map features (like dynamic Google Maps) may require you to provide your own API key.
Q4: Can I change what data is displayed in a template? For example, show speed on an altitude graph?
A: Yes. In the Properties window for widgets like the Altitude graph find the "Telemetry metric" option. You can use this to switch the displayed data, for instance, from altitude to speed. The "Units" option will also change accordingly.
Q5: Where can I find tutorials on creating custom gauges and dashboards?
A: Please visit our official YouTube channel. The article also references specific videos for creating custom widgets and working with GoPro footage.
 A guide to inputting the exact height and width for your project's dimensions
 Using the snapshot tool to create a still image of your gradient design


 / @VSDCFreeVideoEditor