 User Help Manual
  Learn FAQ
  Send us feedback
 ")


How to Work with the Scopes Window in VSDC
How do you evaluate the accuracy of exposure? How do you determine if color correction is necessary? How do you identify overexposed or underexposed areas? Sometimes a mere visual assessment is insufficient to answer these questions and more.
In this article, we will delve into a powerful color analysis tool - histograms, which are accessible in the Free version of VSDC Video Editor. They enable you to objectively assess the color distribution within the frame and determine if color correction is required.
We will guide you through the process of working with this analytical tool to achieve your desired outcome.
 Download Free Video Editor
What is a histogram?
Histograms are visual graphs that display the pixel values of a frame, enabling the analysis of brightness, contrast levels, and color balance of an image. They provide objective information about the characteristics and deficiencies of the image, helping to determine if color correction is required.
In VSDC Video Editor, you can access histograms in the Scopes window, typically located in the bottom right corner of the software. If you don't see the window, navigate to the View tab in the upper part of the program and activate the corresponding option.
At the upper left corner of the Scopes window, you'll find a dropdown menu that allows you to select the object to be analyzed: the selected media file or the overall scene. To fix your selection, click on the selection field with the left mouse button, then with the right mouse button to confirm.
In the upper right corner, there's another dropdown menu offering four Scopes modes: Wave, Parade, RGB, and Vectorscope. Each mode provides information on the brightness and saturation of the pixels in the frame, with slight differences in representation and details.
Let's explore each mode in more detail.
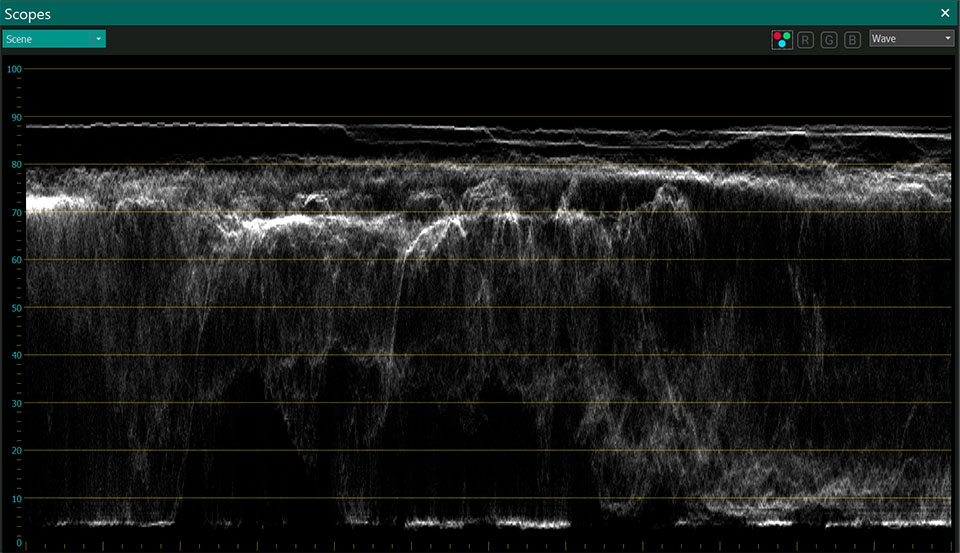
Wave
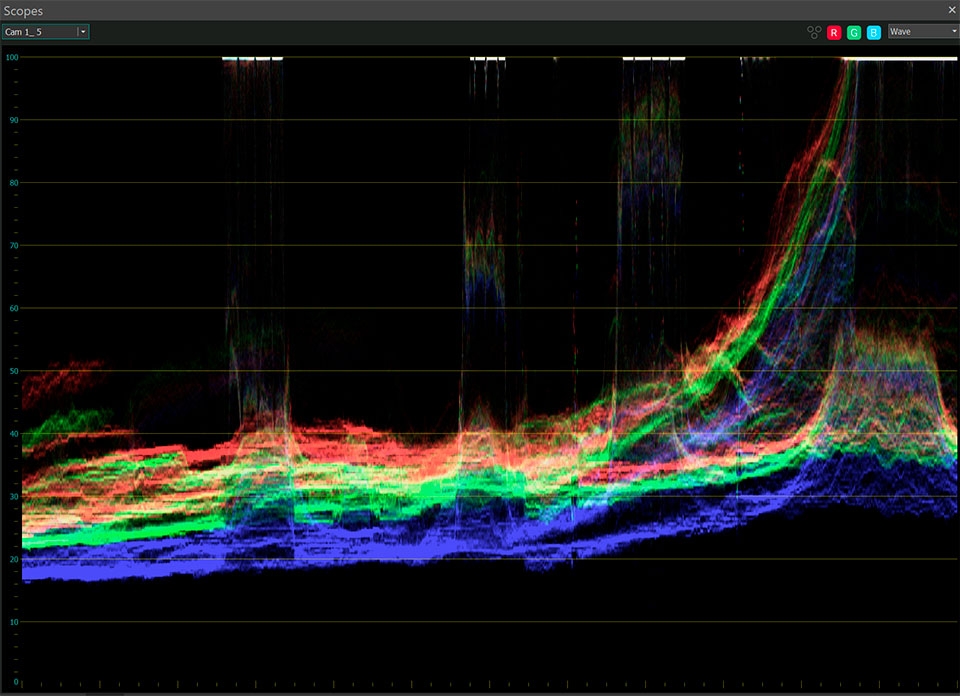
By default, the Scopes window displays the Wave mode, which allows you to analyze the brightness and color values of the scene or selected object. When you place the cursor on a frame in the timeline, you can observe the characteristics of that frame represented as pixels in a waveform on the graph. It's important to note that each column on the graph corresponds to a column of pixels in the object.
The horizontal axis (X-axis) on the graph represents the distribution of color tones of the object from left to right. This means that the left side of the object corresponds to the left side of the graph, and the right side of the object corresponds to the right side of the graph.
The vertical axis (Y-axis) of the graph represents the brightness of color, ranging from 0% for black tones (shadows) to 100% for white tones (highlights).
Let's review several specific examples of using this mode:
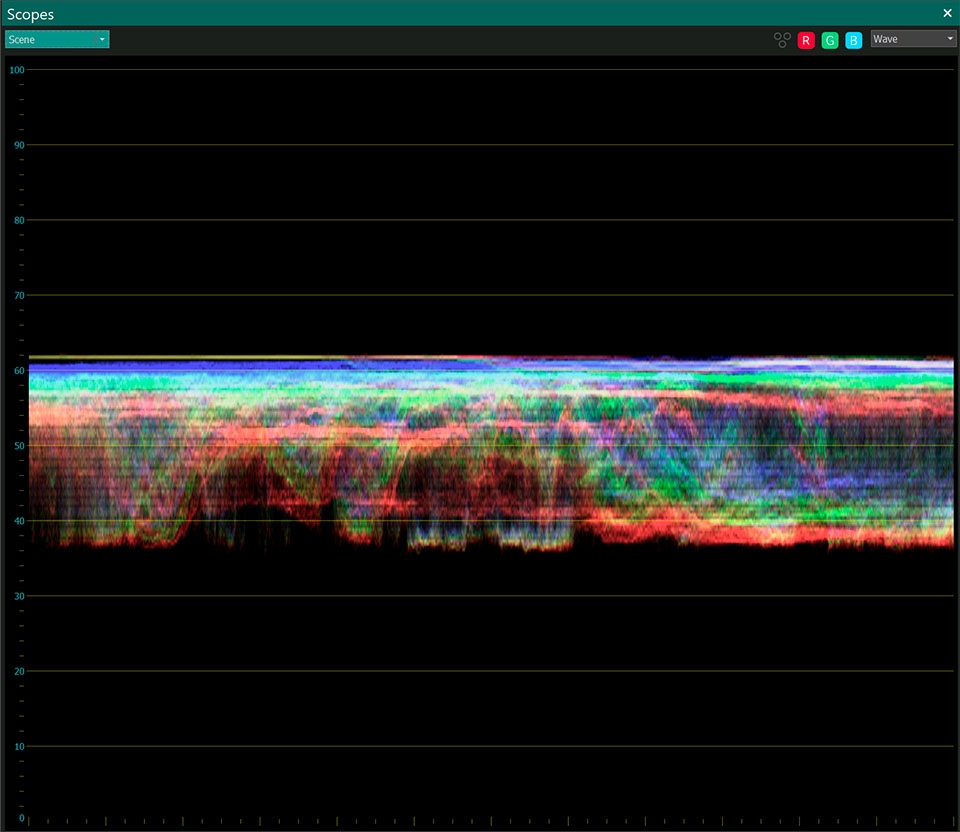
- Uneven brightness: If the graph shows a significant imbalance in the heights between the left and right sides, it may indicate an uneven distribution of brightness. In such cases, you can use the corresponding tools in the Basic Effects window above the Scopes to adjust the brightness or contrast levels and achieve a more balanced distribution.
- High or low contrast: If the graph shows a narrow and high waveform, it may indicate a high contrast in the object, where bright and dark areas strongly contrast each other. In this situation, you may need to decrease the contrast or adjust it to achieve the desired level.
- Lack of details in shadows or highlights: If the graph shows clipped peaks, it may indicate a loss of details in the shadows or highlights of the image. In this case, you can adjust the brightness and contrast to restore the details and create a more balanced image.
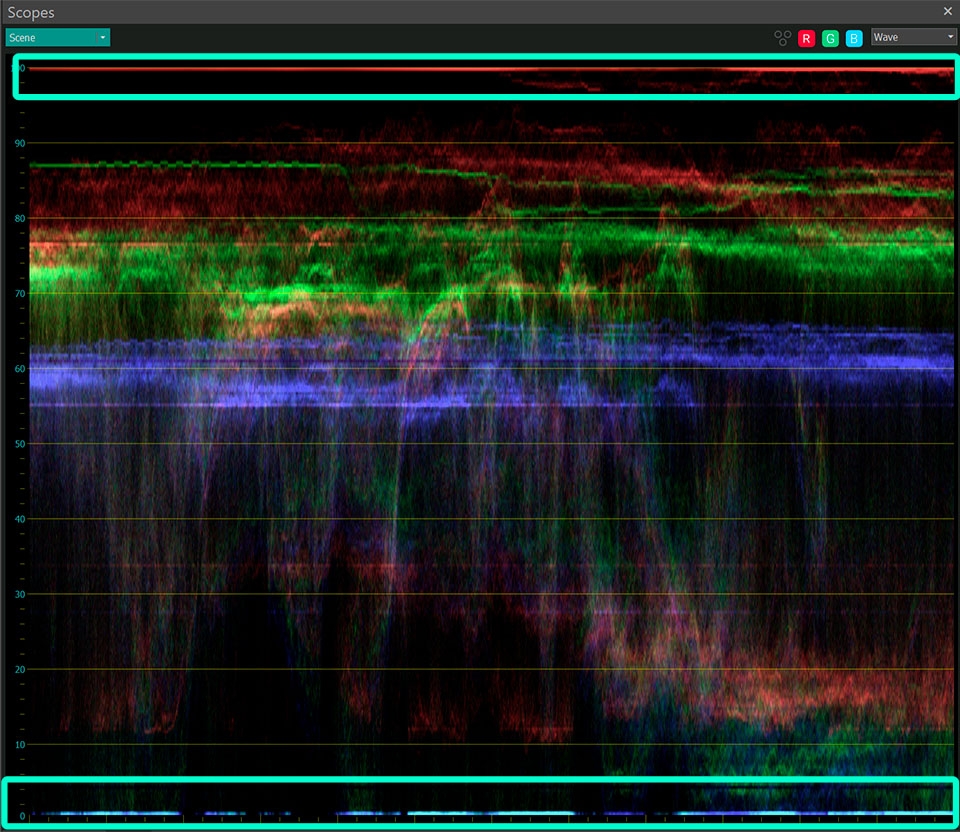
By default, the waveform displays RGB values (Red, Green, Blue) for each pixel. If you need to not only evaluate the brightness and contrast levels but also determine which color components predominate in each area, you can activate the RGB channels separately:
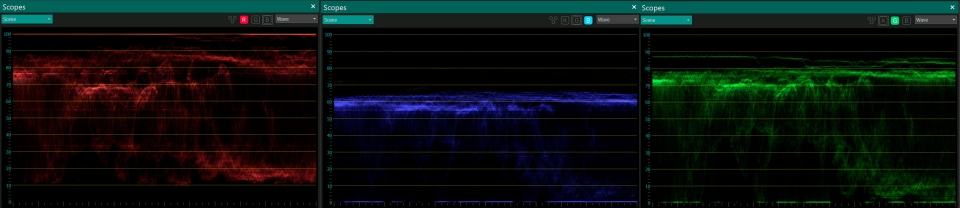
However, if you want to solely focus on the levels of brightness without being distracted by the color components of the object, you can switch to the Luma mode. This mode will display the histogram in black-and-white, showing only the relevant brightness characteristics.
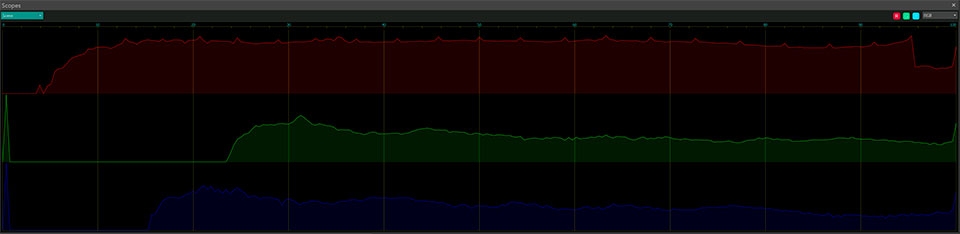
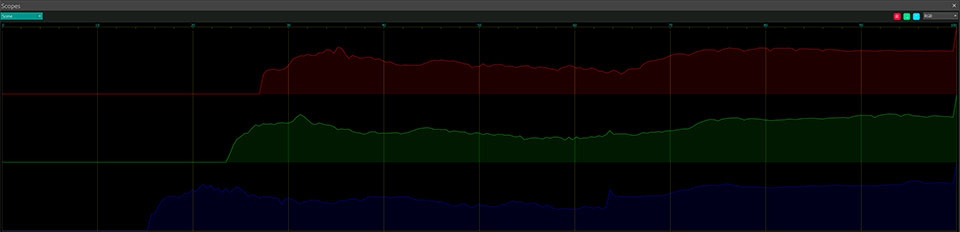
Parade
The Parade mode is useful when you want to determine the predominant color (red, green, or blue) in the scene or object. In this mode, the color channels are displayed closely together without crossing. The horizontal axis (X-axis) represents the selected frame in pixels, with three miniature graphs for red, green, and blue colors respectively, maintaining their orientation. The vertical axis (Y-axis) represents the brightness of the color from dark to light.
By analyzing the graphs of each color channel, you can determine their respective predominance. If one color channel's graph has a higher peak or if the waveform is positioned higher on the graph, it indicates that there are more pixels of that color in the scene or object.
The Parade mode provides a detailed examination of color distribution. If you need to correct a specific color channel, we recommend using the RGB curves tool available in the Color Grading panel. Additionally, you can focus on a specific color by disabling the display of other channels using the corresponding buttons above the graph. This allows you to isolate and make adjustments to individual color channels as needed.
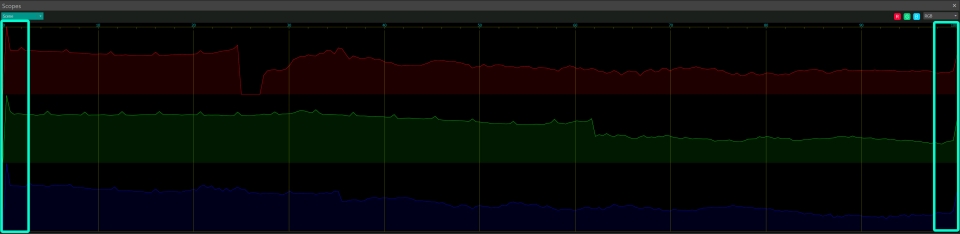
RGB
In RGB mode, the graph displays curves for the three color channels: Red, Green, and Blue. Unlike other modes that are linked to pixel columns of the frame, RGB mode provides tonal information about the object as a whole.
Each color curve is represented by a separate line, showing the distribution of brightness values in a color channel. The horizontal axis represents different levels of brightness, while the vertical axis displays the quantity of pixels at each level. The height and shape of the curves provide information about the predominant color channels and the distribution of brightness among them.
Here are a few examples to consider:
- If the curve of one color channel is higher than the others, it indicates that the object contains more brightness in that particular color.
- If the values on the graph in one or several color channels touch the X-axis, it suggests a loss of color hues. This means that the corresponding color components are absent or insufficient.
- If the graph is shifted to the left, it indicates an underexposed image, where the brightness and details in the dark areas are not prominent enough.
- If the graph is shifted to the right, it indicates an overexposed image, where the brightness and details in the light areas are lost.
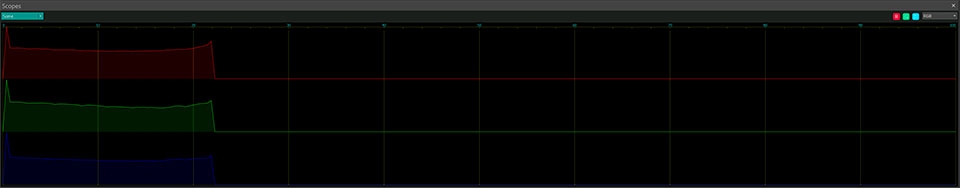
By analyzing the RGB curves, you can gain valuable insights into the overall tonal distribution and make adjustments to achieve the desired color balance and exposure in your video.
Vectorscope
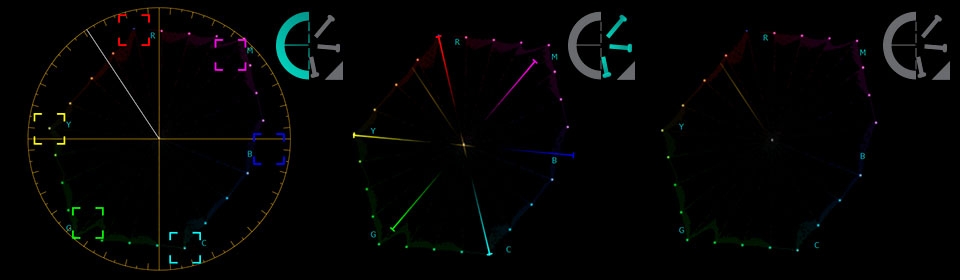
Vectorscope is a powerful tool for visualizing and analyzing the color components of an object. It presents the hues and saturation levels of colors in a selected frame using a circular diagram divided into segments. Each segment represents a specific color, such as yellow, red, magenta, blue, and others, indicated by corresponding square brackets.
Each color segment on the vectorscope has a radius, representing the distance from the center of the diagram to the edge. The length of the radius indicates the saturation or intensity of the color value. A longer radius indicates higher saturation, while a shorter radius indicates lower saturation. For example, if the color value extends beyond the radius of the diagram, it means that the frame is oversaturated.
Above the vectorscope, you will find four options with additional functions:
- Vectorscope modes: The first icon from the left allows you to select from three available display modes. The classic mode displays a vectorscope graph as a traditional circle diagram with indicators, providing a general idea of color distribution in a frame. The vector mode splits the diagram into sectors of different colors, allowing for a more detailed examination of color distribution and specific hues. The Hide graticule/vectors mode shows only the color values of the object on the vectorscope, hiding the sectors, circle, and indicators. This mode is useful when you want to focus solely on the color of the object.
- Color borders: The second icon controls the display of color borders represented as square boxes. There are six of these boxes, and they indicate excessive saturation of the object.
- Color mode: The third icon allows you to toggle the display of color in the graph. When activated, the diagram displays the color palette, illustrating the distribution of hues. When deactivated, the graph displays black, gray, and white hues.
- Skin tone radius line: The last icon activates a line indicating optimal color values for more precise skin tone adjustment. When analyzing a frame with a person in it, you can observe how the pixels on the graph align with this line. If the pixels match the line, it indicates that the color values in the frame correspond to the optimal skin tone color. If the pixels deviate significantly from the line, color correction may be needed to align them.
Once you have selected the mode, you can analyze how the colors and saturation levels are distributed on the vectorscope. If you notice any unevenness or issues on the graph, you can use the corresponding color correction effects or tools from the Lift, Gamma & Gain tools in VSDC. These tools allow you to adjust color values, saturation, and other parameters to achieve the desired result.
Wrapping up
The Scopes window in VSDC provides reliable tools for enhancing the quality of your images. Even with basic skills, you can effectively control the contrast level, saturation, and color balance in your projects without risking the loss of details or making exposure mistakes. We encourage you to explore and experiment with these tools and share your successes with us.
It's important to note that there is no universal rule or one-size-fits-all approach to pixel distribution in a graph. You have the freedom to deviate from the classical representation of the graphs based on your preferences, objectives, or the mood you wish to convey. Feel free to customize and adapt the graphs according to your creative vision.
Should you have any questions, do not hesitate to reach out at This email address is being protected from spambots. You need JavaScript enabled to view it., through Facebook or Twitter.
Watch us on YouTube
 / @VSDCFreeVideoEditor
© 2011-2026, www.videosoftdev.com, FLASH-INTEGRO LLC. Privacy policy | Terms of use | About us
All trademarks referenced herein are the sole property of their respective owners.
Copying any materials from this site allowed only with written consent of Site Administration.