")


- Publicado por Amy Shao em 11 de março de 2026 Qual é o melhor pre...
- publicado por Amy Shao 19/11/25 Conheça a tão aguardada atualização VSDC 10....
- Olá, eu sou Mattea Wharton, videomaker de viagens de Seattle. Durante três anos ...
- published Amy Shao 6/10/25 A espera por algo novo e incomum finalmente acabou!...
How to add charts to your video using VSDC Free Video Editor?
While creating a video presentation or a business slideshow you may need to compare or analyse some information. The best way to ease the understanding of large volume of data is to represent it graphically. The latest version of VSDC Free Video Editor offers this option providing you with a wide array of charts. Let’s see how it works.
Step 1 Getting started
Launch VSDC Free Video Editor and create a new Project or open the Project you have already worked at. To add video or image files to your Project, select the necessary element from the “Add object” drop-down menu on the “Editor” tab or use the corresponding buttons on the toolbar.
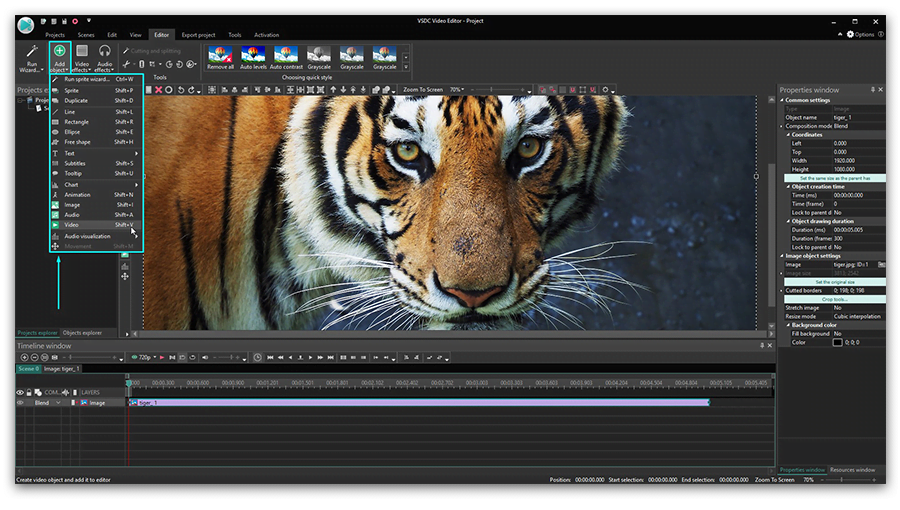
Step 2 Adding a chart
The chart is added to the timeline as a common object. Place the cursor at the moment you want your Chart to appear in the video and click the  button on the toolbar. Later you can change the Chart position adjusting the “Object position settings” or simply using the drag-and-drop method.
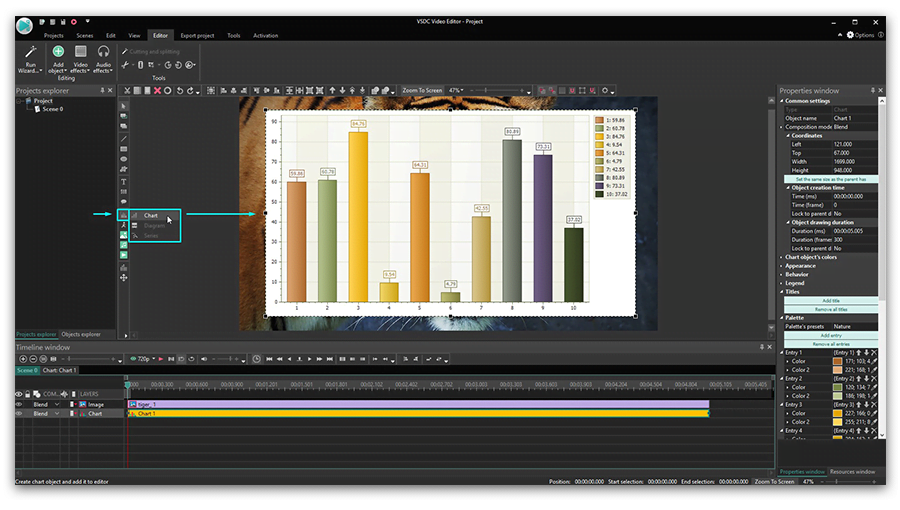
You can also adjust the Chart size so that it fills the entire screen or just a part of it. To do that, select the chart object, place the mouse cursor at one of the black squares and move it. It’s also possible to modify the Chart size changing the “Width” and “Height” values in the “Properties window” on the right. This window shows all the available parameters for customization.
Step 3 Adding data
The chart feature of VSDC Free Video Editor is very powerful. It allows you to represent numeric data graphically.
Double click the chart object at the timeline to open the Diagram properties and change them in the “Properties window”. One chart can contain several diagrams. To add one, click the button on the toolbar and select the “Diagram” option from the drop-down menu.
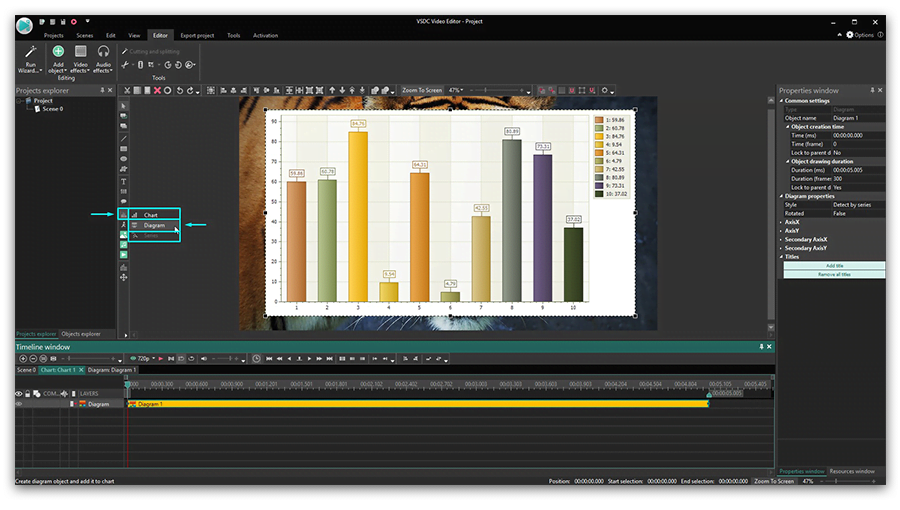
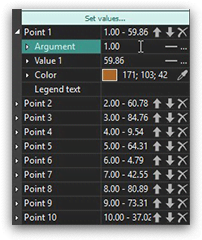
To enter your own data, double click the Diagram object at the timeline. The Series object will appear.
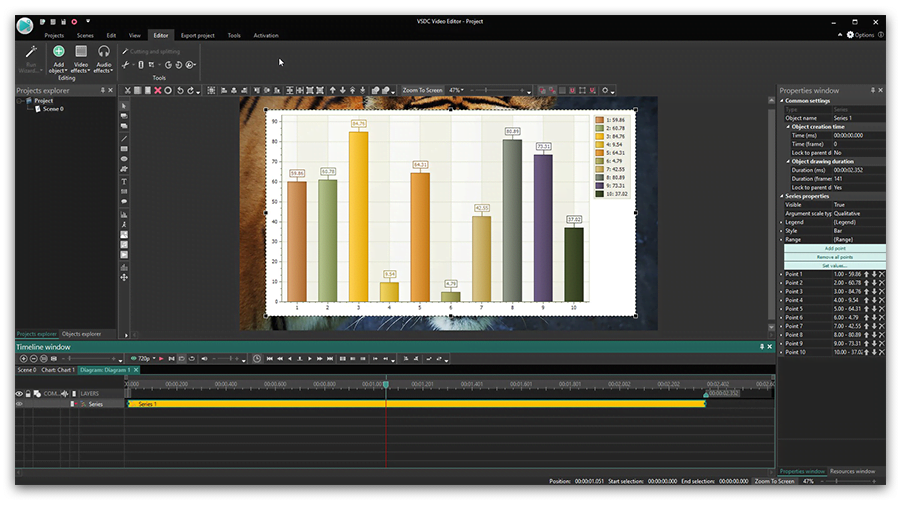
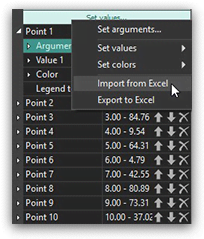
Change its settings, specify Argument, Value and Color of each Point or set your own values. You can change the Value manually clicking the appropriate button and entering necessary numbers or you can import data from Excel clicking the Set values button and selecting the corresponding option.
The parameter of each value can be constant or linear changing in time. Click the corresponding button, select the needed parameter and double click the timeline to set points.
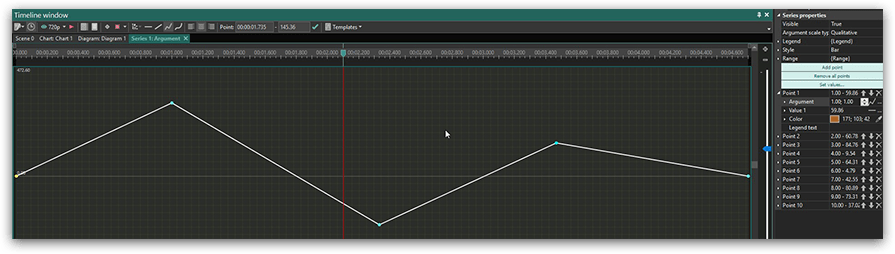
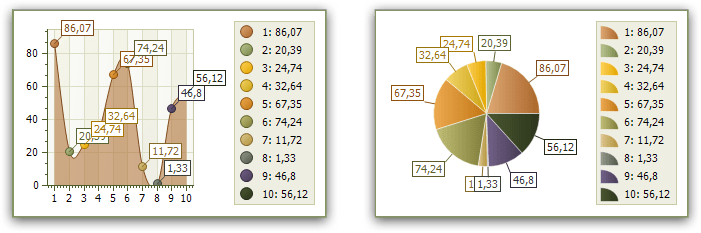
Here you can also customize the graph according to your needs. Click the Style line and select the graph style from the drop-down menu. The available styles are: Bar, Point, Bubble, Line, Pie, Gantt, Pyramid, Area and others.
The same way you’ve added more Diagrams, you can add Series as many as you need.
Thanks to the chart tool added to VSDC Free Video Editor, it’s possible to provide a video presentation with a graph helping viewers perceive information, in other words, to make the complex simple!
You can get more information about the program on Free Video Editor' description page.
Watch us on YouTube
 / @VSDCFreeVideoEditor
© 2011-2026, www.videosoftdev.com, FLASH-INTEGRO LLC. Política de privacidade | Termos de uso | Sobre nós
Todas as marcas comerciais mencionadas neste documento são de propriedade exclusiva de seus respectivos proprietários.
A cópia de qualquer material deste site é permitida apenas com o consentimento por escrito da Administração do Site.