 User Help Manual
  Learn FAQ
  Send us feedback
 ")


- This holiday season embraces new beginnings with the latest update of VSDC Video...
- Change is all about improvement, and this process wouldn't be possible without y...
- Intro In 2024 the options range for creating visual effects is incredibly dive...
- Are you ready to explore new heights with the latest major VSDC update? Finally,...
Color correction with RGB curves in VSDC Free Video Editor
Oftentimes even when we use professional cameras for video shooting, we get upsetting results: gloomy or overexposed compositions, glares, black background. And if it’s an important event you were trying to capture, there comes huge disappointment. There can be many reasons why your footage came out in poor quality but what really matters is whether it can be fixed. And luckily, in many cases, it is possible, even if you aren’t a professional.
In this article, we will show you how to process photos and videos using simple color correction techniques. Specifically, we’ll be working with RGB curves to change brightness and contrast levels in VSDC Free Video Editor.
Download VSDC to your PC (the program runs on Windows only)
How to open the RGB curves dialog window
After you have installed and launched the program, import the file that needs to be edited. By clicking on it, go to the bottom part of the timeline and select "Color Correction." On the vertical panel in the opened window, click on the icon shaped like three different colored dots - "RGB curves." Upon clicking, the curves dialogue window will unfold.
Changing the brightness and contrast - the basic principles
Working with brightness and contrast of the image is one of the basics of color correction. To change these two parameters in VSDC, the so-called “method of shifting control points in the composite curve mode” is used. Control points are arbitrary points that belong to the curves of the color channels: red, green, and blue.
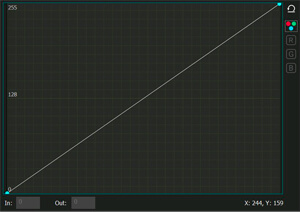
The composite curve mode is set by default, and when you open the RGB working area, it is indicated by a white circle (see the illustration on the right). In the graph, the horizontal axis reflects the original brightness values of the pixels, and the vertical axis - the desired (output) values that you get in the editing process. The maximum pixel brightness value is 255. Initially, when an image is loaded into the program, all the original pixel brightness values are equal to the output. That’s why the composite curve is a straight diagonal line passing through the points with coordinates (0; 0) and (255; 255). Points in the lower left corner correspond to black color (shadows), points in the upper right corner correspond to white color (light areas of the image).
A double-click on a specific area of the composite curve provides the necessary control point. Moving the control points (up and down, right or left) of the curve will change the overall color of the image by adjusting the brightness and contrast.
There are several ways to change the position of control points:
- dragging manually with the mouse.
- using the arrow keys on the keyboard (up, down, right, left).
By changing the coordinates of the points in the lower left area of the graph, you adjust the dark tones in the image. Meanwhile, the upper right area can be used to adjust the light tones, and when you work with the middle region of the curve, it affects medium tones of the video.
Adjusting the brightness of an image in practice
Let’s now jump from theory to practice. By moving the control point up, as shown in the illustration below, you increase the output value of the pixels relative to the input value. In other words, higher (brighter) values are now assigned to the pixels in a given area, which means that the brightness of the video is increased. In the example below, we took a point in the region of dark tones with coordinates (0; 0). An increase in the output value of this point (upward shift) led to the brightening of the dark areas of the image: the black pixels (with the initial value of 0; 0) acquired a more gray tint.
Now, for a clearer example, let's do the opposite and darken the bright areas of the image. By shifting the control point down, you reduce the output pixel values in a given area, which means you lower the brightness. In the example below, a point of the light-colored area with the coordinates of the maximum value (255; 255) was taken as a guide. Reducing the output value of this point led to the darkening of the bright areas of the image.
Contrast level adjustment
The contrast level of the image directly depends on the composite curve inclination angle. Remember that the original curve has a tilt angle of 45°? Increasing the tilt angle increases the contrast level and on the contrary: decreasing the angle reduces the contrast level.
If in the editing process the curve takes on a non-linear look (for example, an S-shaped composite curve), then the contrast level is characterized by the angle of inclination of the tangent built to a specific control point, as shown in the illustration below.
- If the tilt angle is less than 45° - the contrast level of the corresponding image area is lowered (1);
- If the tilt angle is more than 45° - the contrast level of the corresponding image area is increased (2).
So, what do you do if constructing imaginary tangents is not one of your talents? To find out the degree of change in contrast, you can use the simplest mathematical operations:
- Determine the largest and smallest values along the horizontal axis (input values) and the vertical axis (output values).
- Calculate the difference between the highest and the lowest values for each of the axes (input and output option):
(Inputmax – Inputmin) = Differenceinput.
(Outputmax – Outputmin) = Differenceoutput. - Compare the input and the output difference values: the one with a larger difference in values is considered more contrastive.
As an example, consider an image that has the following data:
Inputmin=0;
Inputmax=150.
As a result of adjustments, the image acquires the following values:
Outputmin=30;
Outputmax=250.
Determine the difference between the minimum and maximum values:
Differenceinput=150
Differenceoutput.=220
Comparing the resulting values, we can conclude that the output version of the image has more contrast than the input version (220> 150).
This way, using several control points, you can simultaneously adjust the brightness and the contrast levels in the areas of dark, light and medium tones independently. An extra control point can be deleted by clicking on it and pressing Delete.
Next, we will look at several ways to simultaneously change the levels of brightness and contrast you can apply in practice.
1. Linear brightness and contrast increase.
To simultaneously increase both brightness and contrast, you need to move the control point with coordinates (255; 255) to the left, say, to the value (200; 255).
Therefore, you will get:
- the slope of the curve is greater than 45°, which means a higher level of contrast;
- the input value for the white point will be reduced to 200, and the output will take the value - 255. This will automatically increase the brightness level, since the output value of bright tones will be higher than the input.
2. Linear brightness increase with a decrease in contrast
To increase the brightness of the entire image while reducing the contrast, you need to drag the point with the coordinates (0; 0) up, for example, to the value (0; 50).
This way you get the following results:
- the slope of the curve will be less than 45 degrees, which means that the contrast level will decrease;
- the input value for the black point will remain unchanged - 0, while the output value will be increased to the level 50, which will increase the brightness level and mute / brighten the dark areas of the image.
3. Non-linear brightness increase
As a control point, we’ll take the one with the coordinates (127; 127) - it corresponds with the middle tones of the image. Then we’ll move it up to the value (127; 170).
We will get the following results (see the illustration below):
- the overall tonal range remains unchanged;
- the output value for the selected control point will be increased to 170, which indicates an increase of the brightness level in the mid-tone region;
- the contrast level in the shadow area will be increased since the angle of inclination of the tangents constructed to the guiding points in this area will be more than 45° (2). The image details that were shadowed will become clearer;
- the level of contrast in the area of light tones will be lowered since the angle of inclination of the tangents built to the control points in this area will be less than 45° (1). Details in the light areas of the image will become less clear.
4. Linear brightness and contrast levels decrease
To simultaneously reduce the brightness and contrast of the entire image, you must drag the control point with the coordinates (255; 255) down. For example, drag it to the value (255; 200).
This way we get the following:
- the slope of the curve will be less than 45°, which means a lower level of contrast;
- the output value for the white tones control point will be reduced to 200, with an input value of 255. This means the brightness level will be lowered (since the output value is greater than the input value) and the bright areas of the video will be muted (without affecting the dark areas significantly).
5. Linear brightness decrease with increased contrast
To reduce the brightness of the entire image while simultaneously increasing the contrast, move the control point with coordinates (0; 0) - black color - to the right, for example, to a value (50; 0).
This way we get the following results:
- the slope of the curve will be more than 45°, which indicates that the level of contrast increases;
- the input value for the black point will be increased to 50, while the output value will be 0 indicating a decrease of the brightness level (output value is less than the input value). As a result, the dark areas of the image will become even darker and lose their distinguishable details.
6. Non-linear brightness decrease
As in the case with the non-linear brightness increase, we leave the black (0; 0) and white (255; 255) color points unchanged. As a control point, we take the one belonging to the mid-tone region, with coordinates (127; 127). By moving this control point down, for example, to the level (127; 70), we get the following results:
- the overall tonal range remains unchanged;
- the output value for the selected control point will be reduced to a value of 70, which indicates a decrease in the brightness level;
- the contrast level in the region of highlights will be increased since the angle of inclination of the tangents constructed to the control points in this region will be more than 45° (2). Image details in bright areas will become clearer;
- the contrast level in the shadow area will be lowered since the angle of inclination of the tangents constructed to the control points in this area will be less than 45° (1). This means that the details in the dark areas of the image will become less clear, yet they will not turn into black spots either.
7. Linear contrast increase
Since the level of contrast directly depends on the difference between the values of the lightest and darkest points of the image, the simplest way to increase the contrast of the image is to reduce the gap between the input values of the black and white points. In other words, we need to increase the input value for the black point (shift it to the right) and decrease it for the white point (shift it to the left). For a more detailed correction, see paragraphs 1 and 5.
8. Linear contrast decrease
Similarly to the previous example, the easiest way to reduce the overall level of image contrast is to bring the output values for the black and white points closer together, i.e. decrease the output value for the white point (shift it down) and increase it for the black point (shift it up).
After that, refer to the instructions in paragraphs 2 and 4.
9. How to work with an S-curve
If you need to increase the contrast of the mid-tones only, you should use an S-shaped curve. First, double click to create three control points on the curve. For example, place one in the mid-tone area (128; 128), one in the shadow area, and one in the area of light tones.
Leave the position of the first control point unchanged, shift the second one down (according to the principle described in paragraph 6), and drag the third point up (according to the principle described in paragraph 3). This way, the dark and the light areas of the image will become flatter. The angles of inclination of the tangents built to the control points in these areas will be less than 45°. That means the image details located in the darkest and lightest areas will become less clear, meanwhile, the mid-tones of the image become more contrasting.
Of course, the process of using an S-shaped curve will be slightly different for each image. However, the basic principle remains the same: by increasing the number and changing the position of the control points, it is possible to achieve both amplification and weakening of the visualization of details in the dark, light and medium tones independently.
10. Using the inverse S-shaped curve
The operation principle of this curve is opposite to the operation principle of the above described S-shaped curve.
To reduce the contrast of mid-tones with a simultaneous increase in clarity in the area of shadows and highlights, do the following:
- double-click to create at least three control points. As in the previous example, you can take the midpoint (128; 128), the point in the shadow area and the point in the light area.
- leave the position of the first point unchanged, move the second point up, and the third one - down.
This way, the light and dark areas of the image become more contrasting because the angles of inclination of the tangents built to the control points in these areas will be more than 45°. The image details in these areas will become clearer, while the mid-tones become flatter.
How to use color channels to edit a video or an image
Working with color channels is one way to perform color correction in the RGB mode.
Each color in the RGB color space is achieved by mixing three basic colors: red (Red), green (Green) and blue (Blue). According to the theory we all know, if you mix red and green you get yellow; the mix of red and blue results in purple; the mixture of blue and green results in blue, and so on.
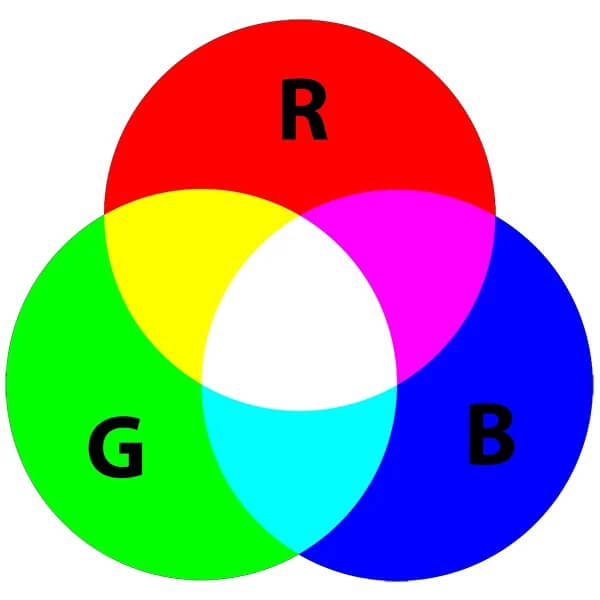
The brightness of each color is set at a value between 0 and 255. The point with zero values for all three curves (0; 0; 0) corresponds to the black color, and the point with the maximum values (255; 255; 255) – corresponds to white.
To switch to the color correction mode of an individual RGB curve, you need to select the desired color channel in the RGB color space.
Double-click on a particular section of the composite curve will create a control point. When you move the control points (up & down, right & left) of the curve, you change the overall color of the image by adjusting the brightness of a particular color in the selected area.
The principles of working with RGB channel curves are similar to the principles of changing the brightness and contrast levels of a video:
- By moving the control point of a particular channel up, you assign richer values of the selected color to the pixels in a given region.
- By shifting the control point down, you assign lower brightness values to the pixels of the selected color channel.
Please note that this process enhances other color channels in the editing area. In the example below, you can see that the decrease in the brightness of image mid-tones in the red channel has led to an increase in the values of blue-green colors and overall darkening of the image.
© 2011-2025, www.videosoftdev.com, FLASH-INTEGRO LLC. Privacy policy | Terms of use | About us
All trademarks referenced herein are the sole property of their respective owners.
Copying any materials from this site allowed only with written consent of Site Administration.